|
|
|||||||||||||
Insurance Risk Prediction Modeling and Insurance Risk AnalysisRisk management is very important for insurance industry. Insurance means that insurance companies take over risks from customers. Insurers consider every available quantifiable factors to develop profiles of high and low insurance risk. Normally level of risk determines insurance premiums. Insurance policies involving factors with greater risk of claims are charged at a higher rate. With much information at hand, insurers can evaluate risk of insurance policies at much higher accuracy. To this end, insurers collect a vast amount of information about policy holders and insured objects. Statistical methods and tools based on data mining techniques can be used to analyze or to determine insurance policy risk levels. Insurance risk predictive modeling using machine learning technique is discussed here. Insurance Risk Analysis and Predicting Insurance Claims RiskIn this page, insurance risk analysis and methods for predicting insurance claims are described;
Hotspot Profiling of Risky Insurance SegmentsProfiling insurance risk factors is very important. The Pareto principle suggests that 80%~90% of the insurance claims may come from 10%~20% of the customer segment groups. Profiling these hotspot segments can reveal invaluable information for insurance risk management. Insurance providers often collect a large amount of information on insured entities. Policy information (such as automobile insurance, life insurance, general insurance, etc.) often consists of dozens or even hundreds of variables, involving both categorical and numerical data with noisy information. Profiling is to identify major factors and variables that best summarize the segments. CMSR Data Miner / Machine Learning / Rule Engine Studio hotspot profiling tools drill-down data systematically and detect important relationships, co-factors, interactions, dependencies and associations amongst many variables and values accurately using Artificial Intelligence techniques such as incremental learning and searching, and generate profiles of most interesting segments. Hotspot analysis can identify profiles of high (and low) risk policies accurately through thorough analysis of all available insurance data. For more on customer risk hotspot profiling, please read customer profiling. Insurance Claims Prediction / Predictive Modeling by Machine LearningIf past is any guide for predicting future events, predictive modeling by Machine Learning is an excellent technique for insurance risk management. Insurance claims prediction models are developed from past historical records of insurance polices, containing financial, demographic, psychographic, geographic information, along with properties of insured objects. From the past insurance policy information, insurance claims predictive models can learn patterns of different insurance claim ratios, and can be used to predict risk levels of future insurance policies. It is important to note that statistical process requires a substantially large number of past historical records (or insurance policies) containing useful information. Useful information is something that can be a factor that differentially affects insurance claims ratios. Insurance Claims Risk Predictive Analytics and Software ToolsCMSR Data Miner / Machine Learning / Rule Engine Studio supports the following robust easy-to-use predictive modeling tools. Users can develop insurance claims prediction models with the help of intuitive model visualization tools. Application and deployment of insurance risk models is also very simple.
Decision Explainability and Modeling TechniquesAs rule-based decision making, decision tree models naturally explain how decisions are reached. Regression also shows some explanations. Neural networks normally have multiple layers. It's very difficult to read how neural networks make decisions. To understand how neural networks reach decisions, neural networks with no hidden layer are recommended. They are regression nerural networks. Does Insurance Claims Risk Predictive Modeling Work?Effectiveness of insurance claims predictive modeling depends on the quality of historical data. If historical data contains information that can predict customer tendencies and behaviors, insurance claims predictive modeling can be very effective. Otherwise reliable insurance claims risk predictive models will be difficult to achieve. Good historical data is essential to produce good predictive models. How can you know whether your customer data contain predictive information? You need to perform variable relevancy analysis and build models and test!
Insurance Claims Risk Scoring by Machine LearningInsurance claims risk scoring is numerical risk ratings of insurance policies. It measures the level of risk of being claimed. The subsequent sections describe advanced insurance risk modeling and insurance scoring methods using predictive modeling techniques of Machine Learning. Why Neural Network and Deep Learning?A commonly used method used in risk prediction is regression. Regression works well if information structure is functional and simple. However it does not perform well on complex information with many categorical variables. Another commonly cited method is decision tree classification. Decision tree is not suitable if dependent variables have heavy skews. Insurance claims data have this skew. Decision tree can work if default/delinquency rate is about, say, 30% ~ 70%. A commonly used method to overcome this problem is the boosting method which duplicates skewed data. But duplication turns outliers into statistically significant patterns, introducing bogus patterns. It produces lots of false positive or negative predictions. This is a bad approach! In fact, all classification methods suffer from mis-classifications. This leads neural network and deep learning based on risk-level scoring methods to be the choice for insurance claim risk modeling. The following figure shows a neural network model; 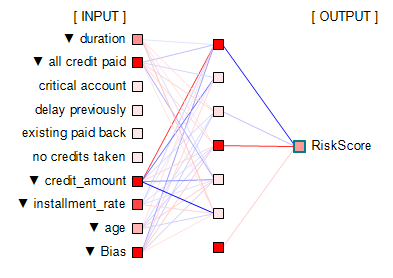
Neural network arranges information in nodes and weight-links as shown in the above figure. Nodes represent input/output values. Nodes are organized into layers: input layer, (optional) internal layers (normally a single layer as in the figure), and output layer. Input layer nodes accept input values. Values of output layer nodes and internal layer nodes are computed by summing up previous layer nodes multiplied by weight-links' values. Neural network weight-links are computed in such a way that given input values, network produces certain output value(s) for output layer node(s). This process is called as network training. This is performed using past data. Neural network is a heuristic predictive system. Bias nodes are similar to coefficients in regression. They have value 1 and tend to improve network's learning capability. The output layer node "RiskScore" produces risk score values, normally between 0 and 1. This can be thought of as claims probability. In the above chart, positive value weight-links are colored in red. Negative value weight-links are colored in blue. Colors are scaled according to absolute value ratios against the largest absolute value. Absolute value zero is colored in black. Largest absolute value is colored in pure red or blue color. The rest are scaled accordingly. It is noted that neural network is not good at predicting unseen information. It can make very wild predictions. Thus good comprehensive training data is very important. For more on neural network, please read Neural Network. In the following sections, insurance claims risk modeling steps are described. Step 1: Develop Neural Network ModelsPredictive models infer predictions from a set of variables called independent variables. To develop models, the first step is to analyze which variables contain predictive information through relevancy analysis. Only relevant variables are recommended to be used as independent variables. CMSR Data Miner / Machine Learning Studio provides tools for variable relevancy analysis. For more on this, please read Variable Relevancy and Factor Analysis, aka, Principal Component Analysis, for Predictive Modeling. Once relevant variables are identified, neural network models can be configured and trained using past historical data. Neural network training is a repetitive process which may take hours and days. Fast computer may be needed. Fully trained models should be tested using past historical data which are not used in training before using them. Single models can have bias and weakness. To overcome this, multiple models can be developed and combined as described in the next section. It is very important to note that the state art of predictive modeling is to develop models that are both accurate and general at the same time. If it's not accurate and general at the same time, models won't predict accurately. These conflicting goals are difficult to achieve without advanced tools. CMSR Studio is well equiped with poweful modeling tools. Step 2: Combine Neural Network ModelsOnce models are fully trained and tested, they can be integrated to produce combined outputs such as largest (=maximum), smallest (=minimum), average, average without largest and smallest values, etc. This can be done using RME-EP (Rule-based Model Evaluation available in CMSR Studio) easily. Testing predictive insurance claims risk models requires data visualization tools. The following histogram shows largest (=maximum) scores and risk distribution in past historical data. "RiskScore" represents the combined largest (=maximum) values horizontally. Vertically risk (=claimed) proportion (in red color) is shown. Note that the label "Risk" represents historical data which were in claimed state. It clearly shows that higher scores have higher proportion of risk in the past historical data. So the models are effective and useful. Note that the neural network models are trained to predict values between 0 and 1. This can be a bit higher and a bit lower value as seen in the histogram. 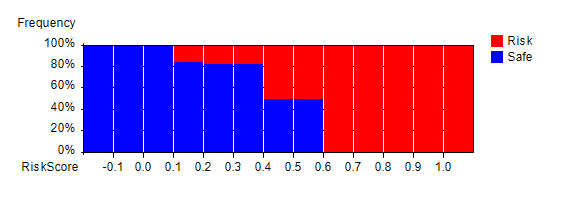
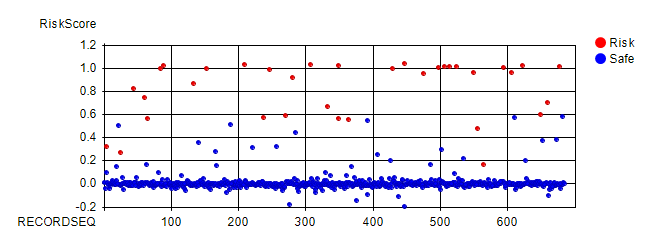
The following figure plots data of the above chart. "RECORDSEQ" (=record sequence) is used to spread data horizontally so that data can be seen easily. Vertically it shows maximum values scored by models. Red circles represent historical data records that were insurance claims. Clearly this plot shows higher the score is, higher the claim risk. Score 0.6 and above was all insurance claims. Score 0.4 to 0.6 also has high risk. Score 0.1 to 0.4 has medium risk. The rest has low risk.
Step 3: Risk Scores to Risk ClassificationClaims risk scores produced by neural network and RME-EP models can be confusing to users. It will be better if they are verbalized into more easily understood vocabularies such as "Very high risk", "High risk", "Medium risk", "Low risk", etc. The above histogram clearly shows that if maximum risk score is equal or greater than 0.6, it has 100% claim risk. So it can be coded as "Very high risk". The next class is if maximum risk score is equal or greater than 0.4, it has "High risk". The next class is if maximum risk score is equal or greater than 0.1, it has "Medium risk". The rest has "Low risk". This classification can be easily implemented with RME-EP rule engine models. This produces risk distribution as in the following proportional bar chart. This chart shows how each class had claim risk in the past historical data. 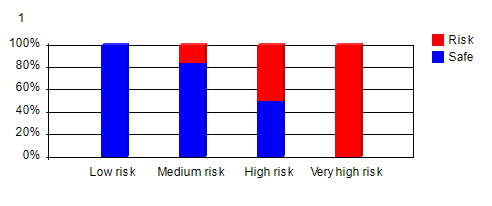
* Note that models and charts used in this page are produced using CMSR Data Miner / Machine Learning / Rule Engine Studio and are based on artificially generated data. For software download, please visit CMSR Download & Install. For more details on these modeling steps, please read;
|

|
||||||||||||